Vortex is a telemetry visualization application built in React and d3.js. It is used in five missions: MSL (Curiosity), Cassini, Dawn, SMAP, and MER (Opportunity). I was responsible for leading the project, including project management, customer relations, user-centered design, visual design, and front-end development. (I also came up with the project's backronym, which is Visually Organize and Represent Telemetry for Examination and eXploration)
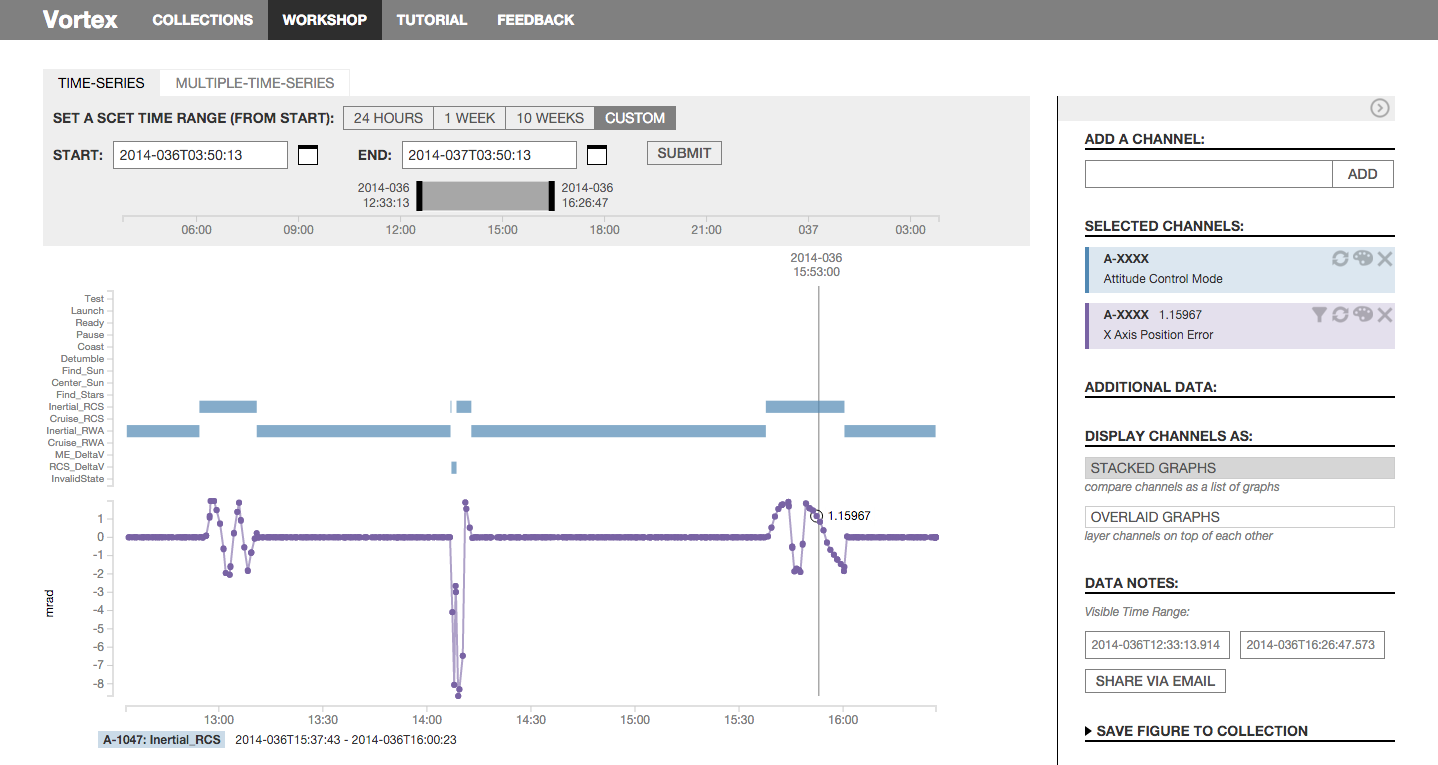
The application works with two types of telemetry, channels and event records (EVRs). Channels are time-series datasets, and can either represent float or "enumerated" values. The latter encode states as float numbers, which are transmitted and then decoded in post-processing. Vortex offers several ways to display both types of channels, as well as a variety of ways to customize the graph representation (color, filtering, adjusting the scale).
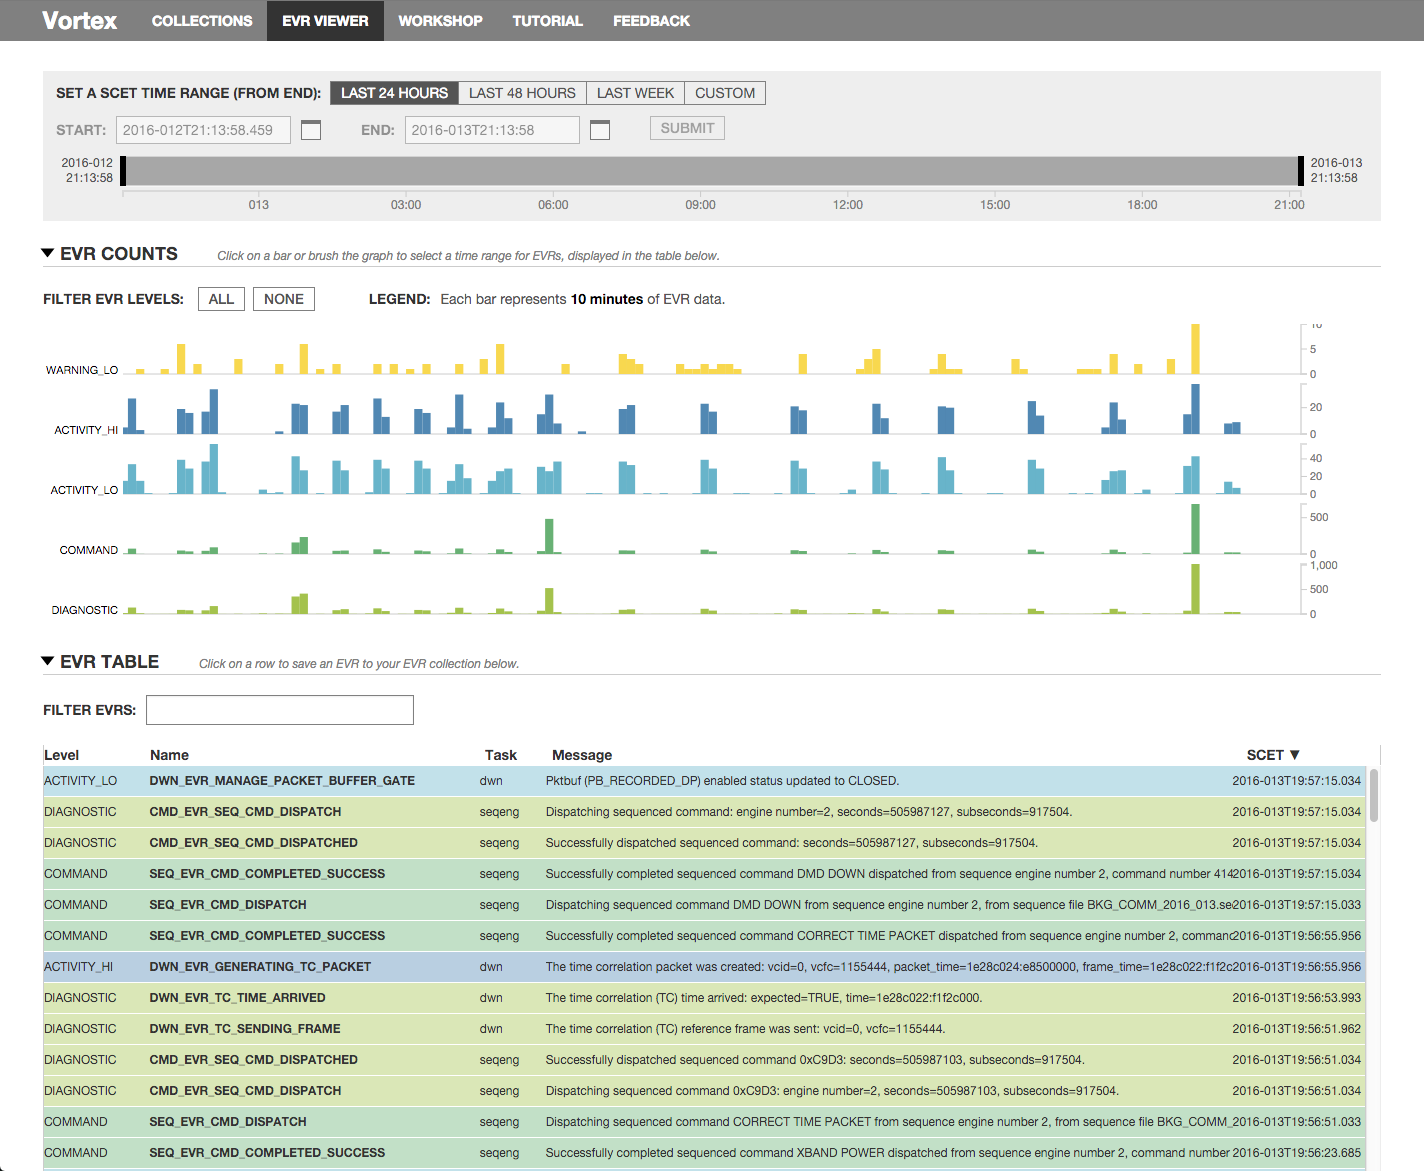
The second primary type of telemetry data are EVRs, which act like log statements for the spacecraft. Vortex includes a histogram of EVR types, which operators have referred to as the "heartbeat" of the spacecraft. There is also a more traditional table representation of the EVRs, with the ability to filter them on several axes.
The operator also has the ability to select specific EVRs by clicking on them, and then overlaying these items on top of channel data. This allows them to correlate the two types of telemetry data over time, which speeds up the process of anomaly analysis.
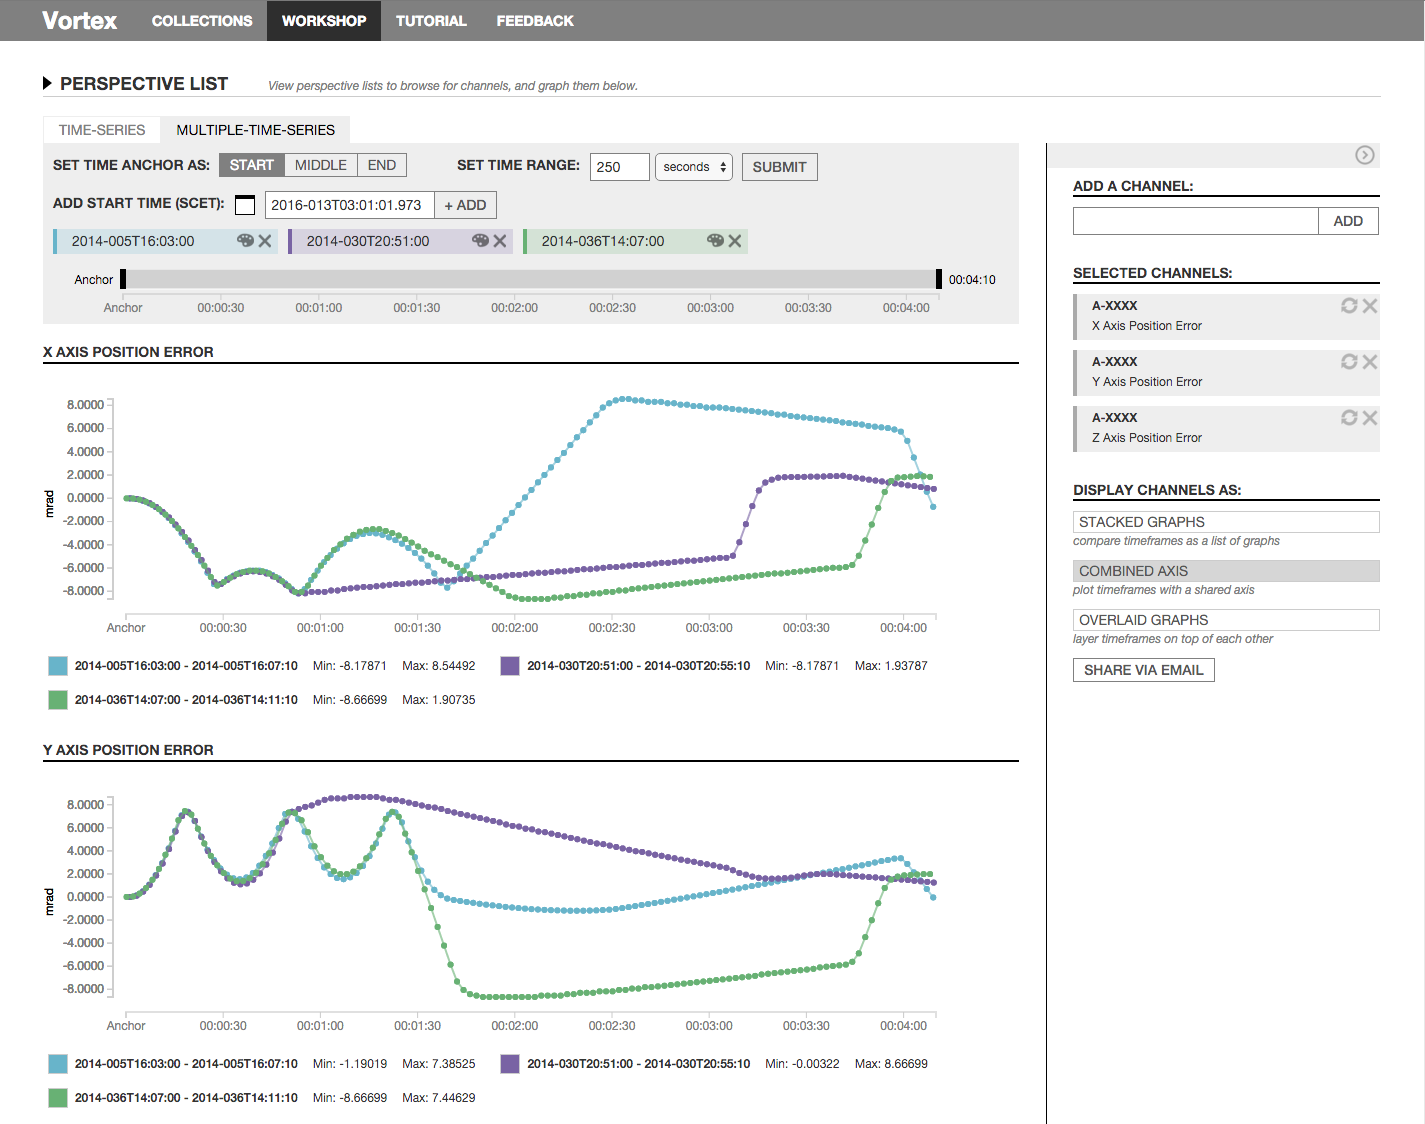
The application includes an additional mode for display multiple time periods of the same channel. Below are instances when Cassini turned on their thruster engines, and the resulting X and Y axis position errors on these channels.
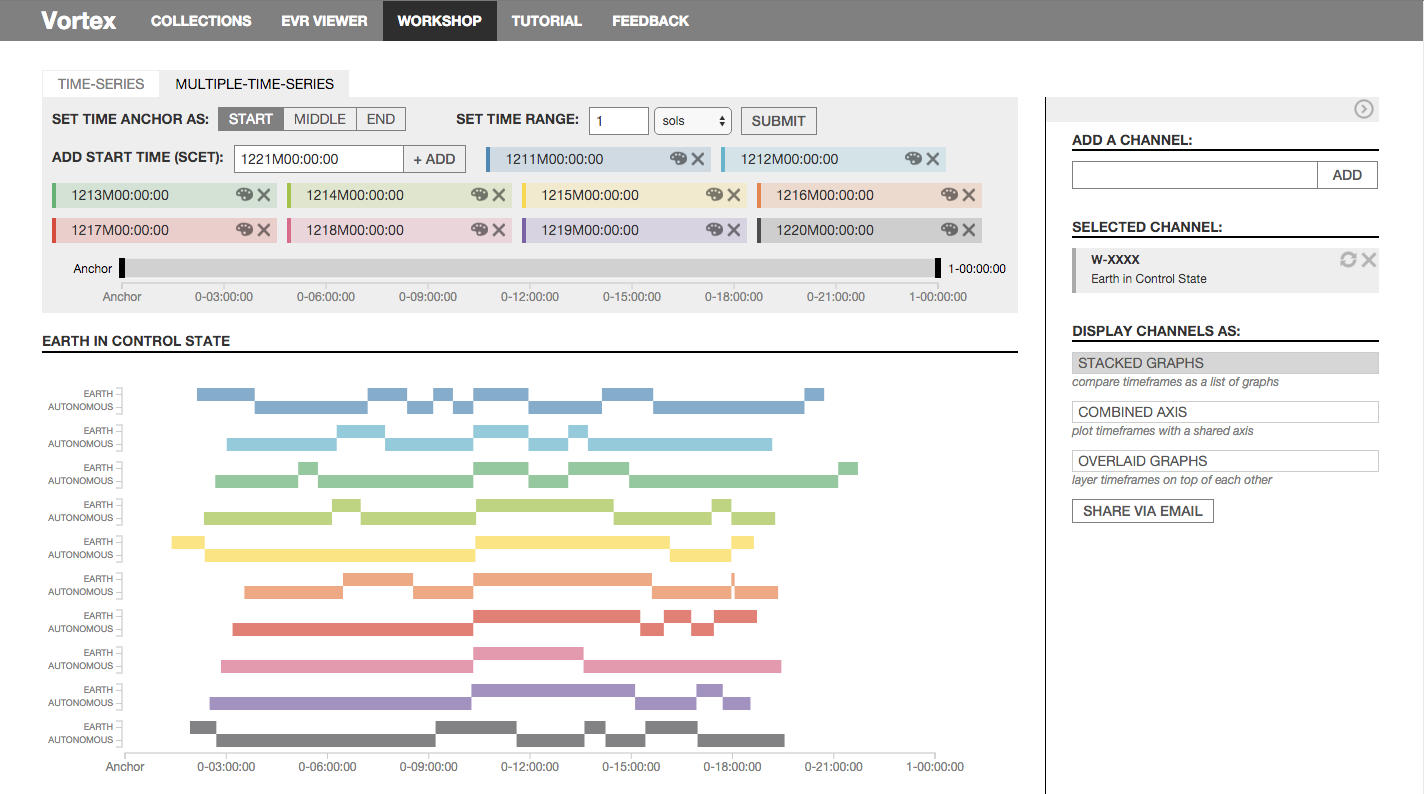
Below is the same idea for an enumerated channel, which specifically is showing the diurnal schedule of MSL's wake periods (a sol is a martian day).


